The properties and control characteristic curve of the fuel cell are examined for designing the overall power conversion system to obtain the required voltage and power output for various applications.
Fuel Cell Losses
Several sources contribute to irreversible losses in a practical fuel cell. The losses, which are often called polarization losses, originate primarily from three sources:
(1) Losses due to the rate of reaction,
(2) Ohmic or resistance loss, and
(3) Concentration polarization or gas transport loss.
These losses result in a cell voltage (V) for a fuel cell that is less than its ideal potential, E (V = E − Losses).
Fuel Cell Characteristics Curve
A typical voltage-current characteristic of a fuel cell is shown in Figure 1. As can be seen, the actual voltage decreases as a function of the current drawn from the fuel cell.
As shown, fuel cell I-V characteristic curve is divided into three regions: R-1, R-2, and R-3. The point at the boundary of regions R-2 and R-3 is known as maximum power density point or knee/optimum point.
Loading the fuel cells above the maximum power point (MPP) current will shift the operating point right of the optimum point (region R-3) causing a sudden collapse of the fuel cell voltage to zero. Therefore, no power could be drawn from the cell.
Extended operation in region R-3 may damage the fuel cell. Fuel cells are generally operated in the region R-2 of the characteristics shown in Figure 1.
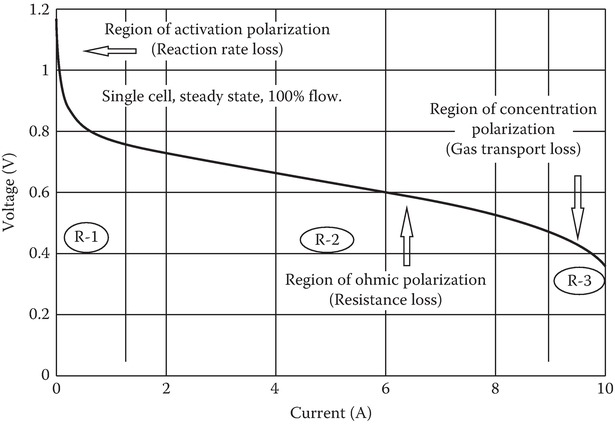
Figure 1 Typical fuel cell V–I characteristic curve.
Various PEMFC characteristics as a function of typical values of current density are presented in Figure 2.
Figure 2a is referred to as the performance curve showing the voltage as a function of the current density. The efficiency indicated on the secondary vertical axis is proportional to the cell voltage.
The power density is shown in Figure 2b as a function of the current density. The efficiency as a function of power density is shown in Figure 2c. The efficiency increases at light load. The dotted line demonstrates above the maximum power regime.
Figure 2d shows a typical efficiency characteristic of a complete fuel cell system in a vehicle, as a function of load power. It also compares with the thermal efficiency with a typical internal combustion engine (ICE) in a vehicle.
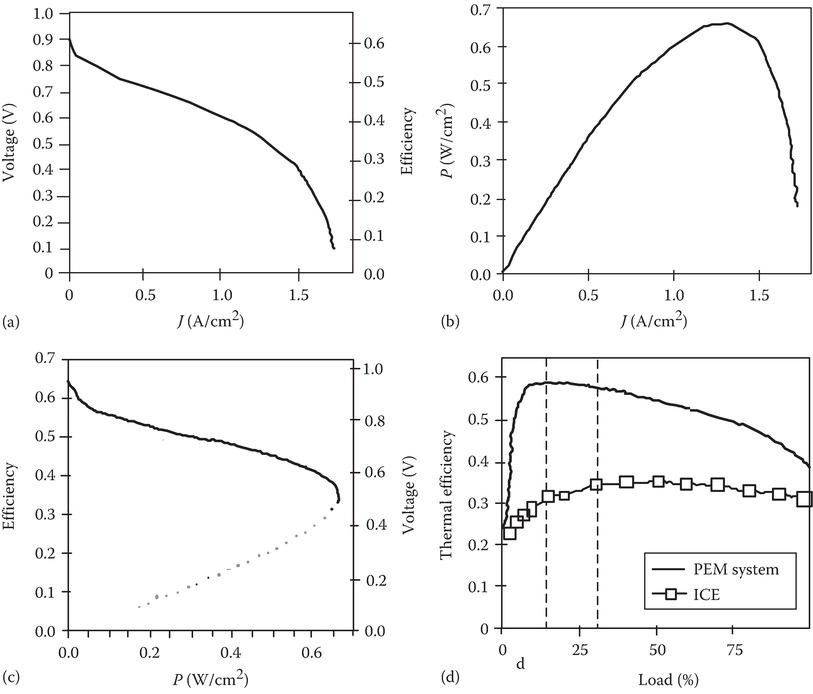
Figure 2 Typical characteristic curves of a PEMFC: (a) performance curve, (b) power density, (c) efficiency, and (d) system efficiency.
The fuel cell output current and output power are controlled by controlling the fuel flow input to the fuel cell. The MPP moves to higher current levels with an increase in fuel flow and therefore increases the ability of fuel cell to transfer higher power to the load as shown in Figure 3.
Fuel flow is the main parameter that controls the power transfer capacity of the fuel cell. For efficient operation of the fuel cells, the operating point should be adjusted as a function of the electrical load.
The flow rates of both fuel and oxidant are controlled to ensure that the stoichiometric ratio remains in the design range to ensure a good balance between the reactant supply, heat, water management, and pressure drop.
Fuel cells are slow in responding to the fast electrical load transients because of slower internal electrochemical and mechanical dynamics.
Load transients create a harmful low-reactant condition inside the fuel cells and shorten their life. The difference between the time constants of the fuel cell and electrical load calls for an energy storage unit that would supplement the peak power demand from the fuel cell during transients.
The secondary energy source such as a battery or ultra-capacitor: (1) compensates for the slow fuel cell dynamics, (2) responds to the fast-changing electrical load during transients, and (3) provides the power to the load until the fuel cell output is adjusted to match the new steady-state demand.
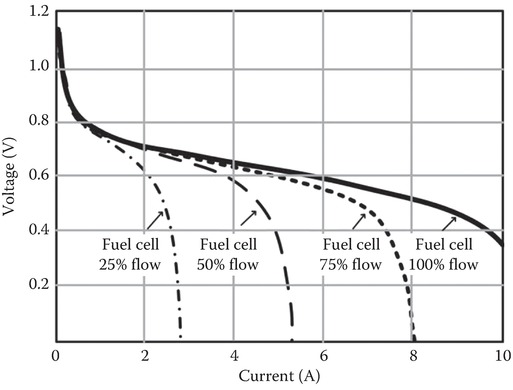
Figure 3 Variation of fuel cell output and MPP with fuel flow.
Fuel cells are very sensitive to low-frequency ripple current. While feeding the low-frequency alternating current to the utility or AC load from a fuel cell–based power plant, a second harmonic component of the line current may appear at the fuel cell stack.
The low-frequency ripple current reaching the fuel cell may move the operating point from region R-2 to R-3 (Figure 3), thus leading to unstable operation of the fuel cell system.
This may result in the mal-operation of the fuel cell power unit, and hence, the system may shut down. Therefore, this low-frequency current should be absorbed.
Figure 4 shows how the peak-to-peak current ripple from a fuel cell stack affects the efficiency of a fuel cell and fuel utilization.
Because of the ripple current, the fuel flow may have to be adjusted to peak value (instead of average) resulting in the waste of fuel leading to higher cost of energy and poor efficiency and utilization.
Fuel utilization is very important for a better overall system efficiency. In practice, the fuel utilization rate should be above 80%–85%.
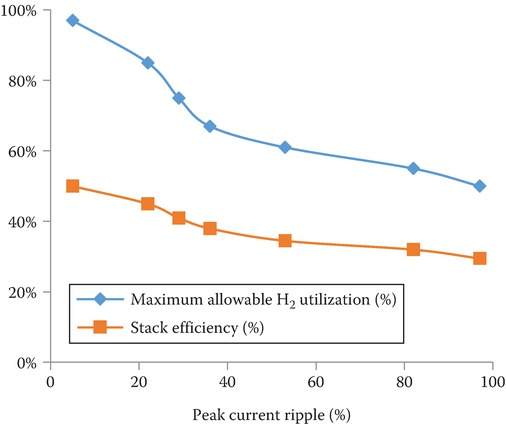
Figure 4 Effect of current ripple on fuel utilization in fuel cells.
Key Takeaways
Understanding the properties and control characteristics of fuel cells is essential for optimizing their performance in real-world applications. The voltage-current characteristic curve, along with key regions such as the maximum power point (MPP), dictates safe and efficient operation—preventing voltage collapse and potential damage. Fuel flow regulation ensures proper power output, while managing polarization losses (activation, ohmic, and concentration losses) enhances efficiency. Additionally, fuel cells’ slow response to load transients necessitates hybrid energy systems with batteries or ultracapacitors to handle peak demands and improve dynamic performance. Mitigating low-frequency ripple currents is also critical, as they can destabilize operation and reduce fuel utilization, impacting overall system efficiency.