The article provides an overview of self-inductance and its unit of measurement, explaining how inductors resist changes in current due to magnetic fields. It also discusses the behavior of RL circuits, focusing on their transient response and the concept of time constant during changes in current flow.
Inductance: Inductance can be defined as the property in an electric circuit that resists a change in current. This resistance to a change in current is the result of the energy stored within the magnetic field of a coil.
A coil of wire has inductance. Some electrical items that contain coils are relays, motors, transformers, radio transmitters, radio receivers, and speakers. An inductor is an electronic component that is used to produce inductance in a circuit.
Figure 1 shows the schematic symbol for an inductor with and without an iron core. There are a number of other names for the inductor. These names include coil, reactor, and choke.
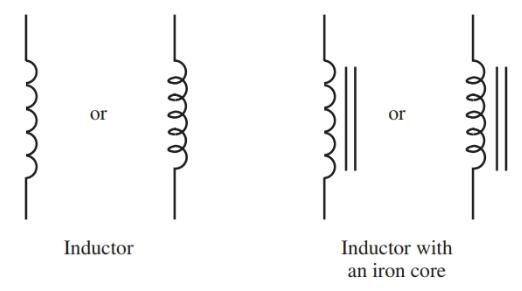
Figure 1. Schematic symbols for an inductor with and without a core.
Set up the experiment as shown in Figure 1 (a), using the hollow coil connected to a galvanometer. Move the permanent magnet in and out of the coil and notice the deflection of the needle in the meter.
When the magnet moves in, current flows in one direction. The current reverses direction when the magnet is withdrawn. No current flows unless the magnet is moved.
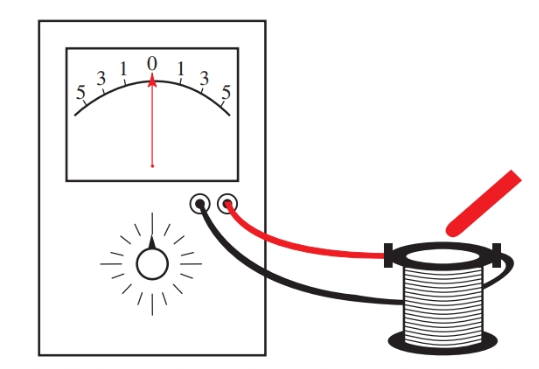
Figure 1 (a). Use a galvanometer, a coil, and a magnet to observe the principles of magnetic induction.
By moving the magnet, a voltage is induced in the coil, which causes current to show on the meter. There is a distinct link between the magnet movement and the current’s direction. This is an application of Lenz’s law:
The field created by induced current is of such a polarity that it opposes the field of the permanent magnet.
A coil connected to a source of direct current builds up a magnetic field when the circuit is closed. The expanding magnetic field cutting across the coil windings induces a counter emf. This voltage opposes the source voltage and opposes the rise in current.
When the current reaches its maximum value, there is no further change in the current. Consequently, there is no longer an induced counter emf. The current is now only limited by the ohmic resistance of the wire.
If the source voltage is disconnected:
- The current in the circuit falls to zero.
- As the current falls to zero, the magnetic field collapses.
- As the magnetic field collapses, it again induces a counter emf. This counter emf is in the opposite direction of the counter emf created when the coil was energized. This counter emf now retards the reduction of current.
Inductance Unit
The inductance of the coil resists any change in current value. The symbol for inductance is L.
Inductance is measured in a unit called a Henry (H).
A Henry represents the inductance of a coil if one volt of induced emf is produced when the current is changing at the rate of one ampere per second. This is expressed mathematically as:
\[E=L\times \frac{\Delta I}{\Delta t}\]
Where E equals the induced voltage, L equals the inductance in henrys, ΔI equals the change of current in amperes, and Δt equals the change of time in seconds. Note that the symbol Δ means “a change in.”
Producing Stronger and Weaker Magnetic Fields
The strength of an induced voltage depends upon the strength of the field. It follows then that a stronger magnetic field produces a higher induced voltage. This magnetic field can be strengthened by inserting a core in the coil. An iron core has higher permeability than air and concentrates the lines of force.
Large inductors are most often wound on laminated iron cores. Their inductance is measured in Henrys. Smaller inductors, used in circuits that operate at higher frequencies, can have powdered iron or air cores. They have inductance measured in millihenrys (1/1000 of a Henry) and microhenrys (1/1,000,000 of a Henry). Radio-frequency chokes using air cores are shown in Figure 2.
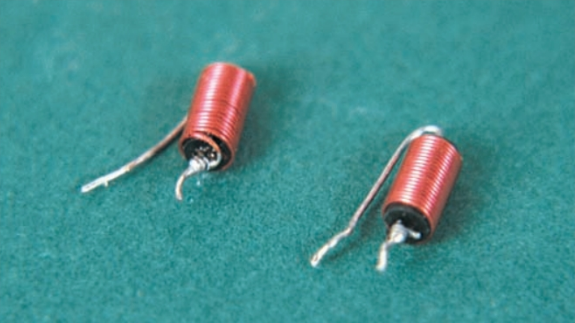
Figure 2. Radio-frequency chokes.
The core material is just one factor that affects the size of the inductance produced by a coil. Figure 3 is a chart that diagrams inductor traits that can strengthen or weaken a coil’s inductance.
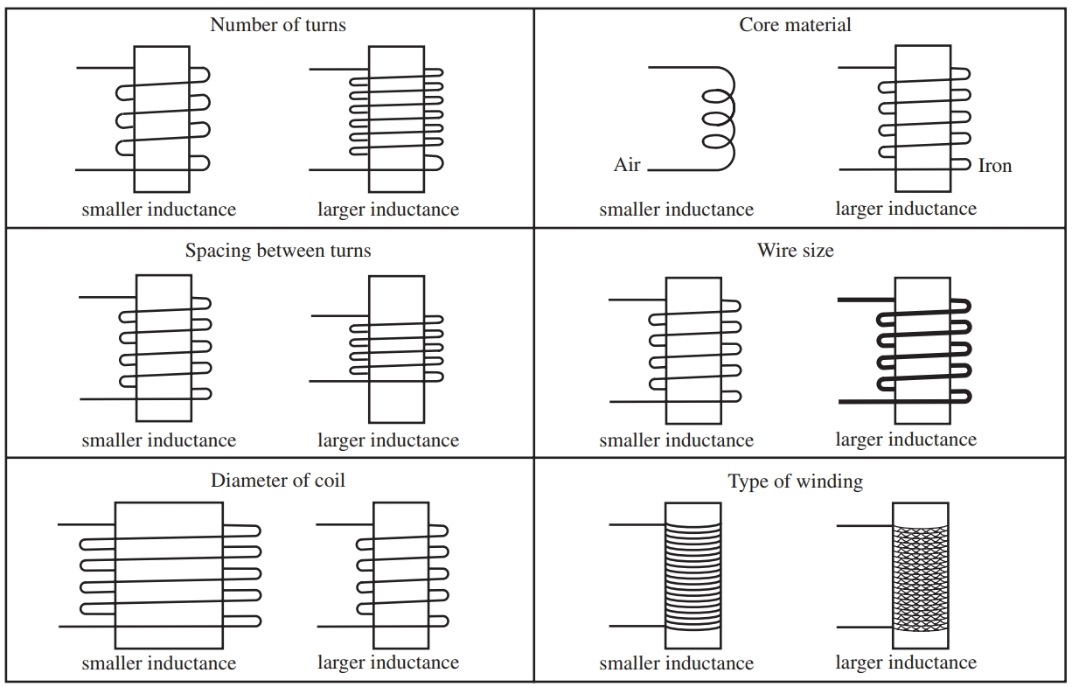
Figure 3. Chart of some of the factors that affect a coil’s inductance.
Self-Inductance Definition
A changing current through an inductor produces an expanding or collapsing magnetic field cutting across the wires of the coil. A counter emf is induced that opposes the change of current. This action is called self-induction.
The strength of the self-induction depends on the number of turns of wire in the coil, the link between the length of the coil and its diameter, and the permeability of the core.
RL Circuit Transient Response
Definition: The response of the current and voltage in a circuit after an instant change in applied voltage is known as a transient response.
A coil is connected to a dc voltage source. Refer to the diagram in Figure 4. When the switch is closed, the current builds up gradually. This effect is due to the inductance of the coil and the internal resistance of the battery.
When the switch is opened, the current decays in a like manner. The rise and decay of the current in this circuit is shown in the graph in Figure 5.
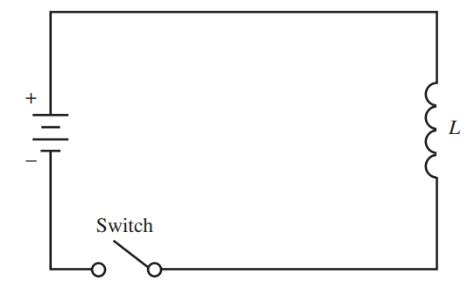
Figure 4. Schematic diagram of an RL circuit.

Figure 5. The graph shows the transient response of the RL circuit as the switch is closed and opened.
It is important to understand that the opposition to the rise or decay of current occurs only when there is a change in applied voltage.
When there is no change, the current remains at its steady-state value. This steady-state value depends only on the resistance of the coil.
A resistance is joined in series with an inductor in the circuit in Figure 6, view A. A circuit that contains resistance and inductance is called an RL circuit.
For example, when the switch is closed, the counter emf of the coil, L, equals the source voltage, view B. Since no current has started to flow, the IR drop across R equals zero.
As the current gradually builds up, the voltage ER increases. And counter emf EL decreases until a steady state condition exists. All the voltage drop is ER, and there is no drop across L, view C.
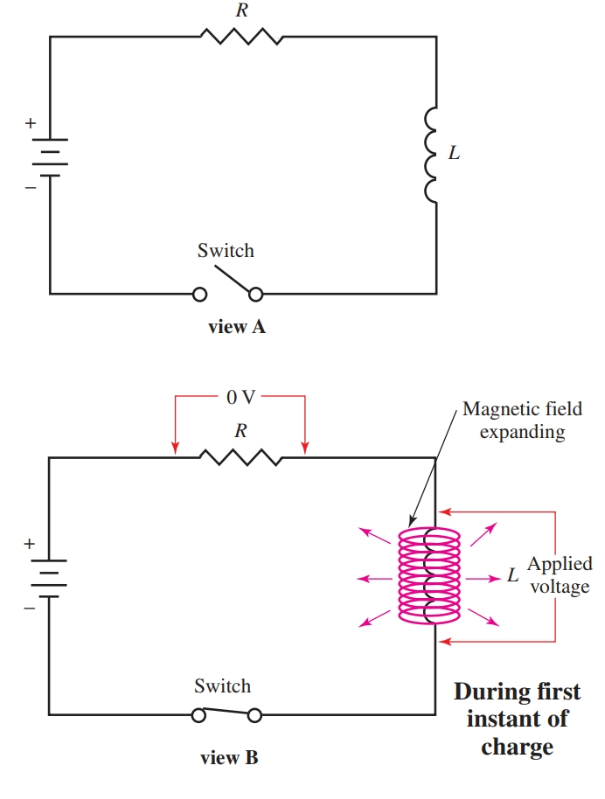
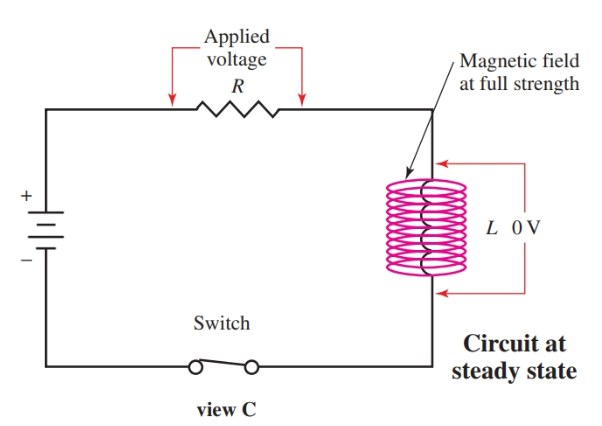
Figure 6. A diagram of the RL circuit showing the transient response.
If the RL circuit is shorted by another switch, Figure 7 view A, the stored energy in the field of L instantly develops a voltage, view B. This voltage is of the opposite polarity of the applied voltage. The circuit is discharged by current flowing through R. The graphs showing the charge and discharge of the circuit appear in Figure 8.
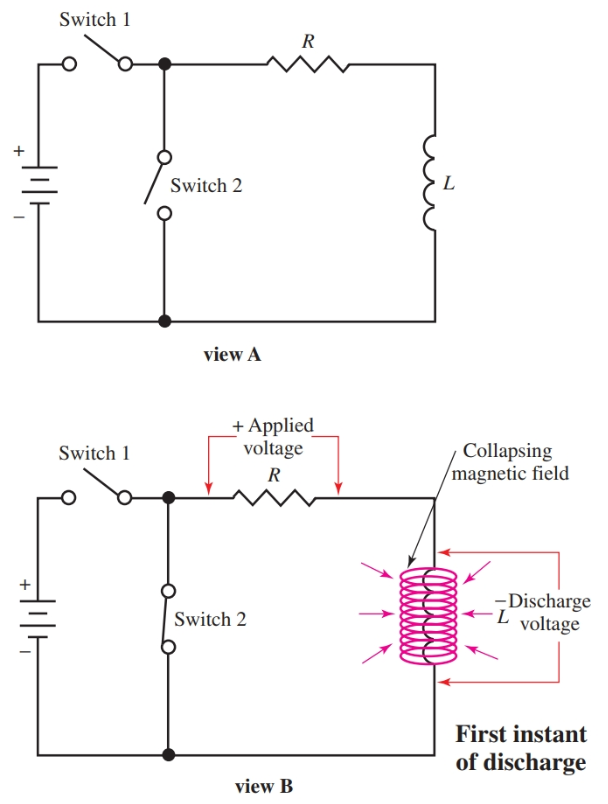
Figure 7. The coil L is shorted through switch 2. The magnetic field collapses.
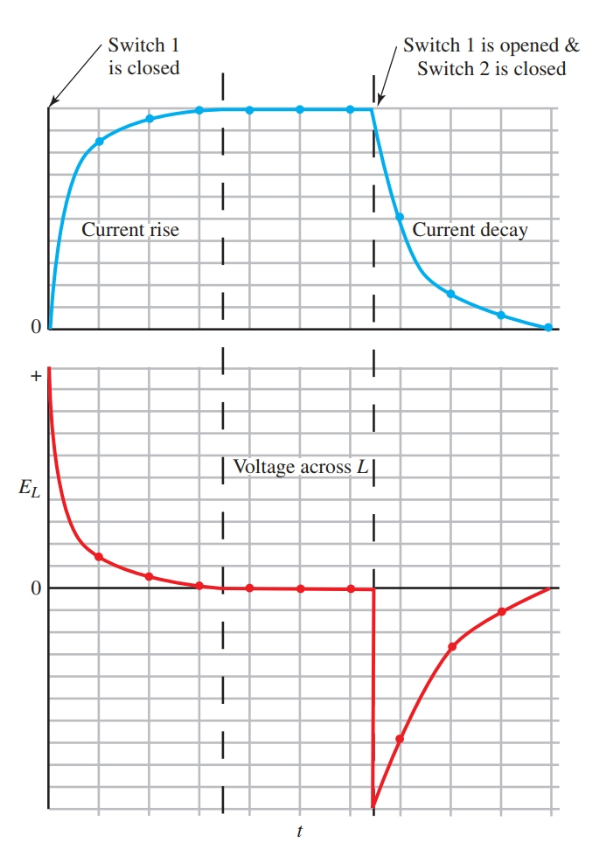
Figure 8. The transient response curves for current and inductive voltage of the RL circuit.
The baseline, or x-axis, of these graphs, represents time. The transient response of an RL circuit does require a certain amount of time.
RL Circuit Time Constant
The amount of time to complete the transient response depends upon the values of R and L in the circuit. This value is called the time constant (τ) of the circuit. For an RL circuit, it is found using the formula:
\[\tau =\frac{L}{R}\]
Where τ equals the time in seconds for the current to increase to 63.2 percent of its maximum value or to decrease to 36.7 percent of its value.
In most cases, a circuit is considered fully charged or fully discharged after a period of five-time constants. The top of Figure 9 is a graph showing the percentage of the full charge against the number of time constants.
From this graph, you can see why five-time constants are considered full charge or discharge. The bottom of Figure 9 is a chart giving the voltage at the end of each time constant, assuming a source voltage of 100 volts.
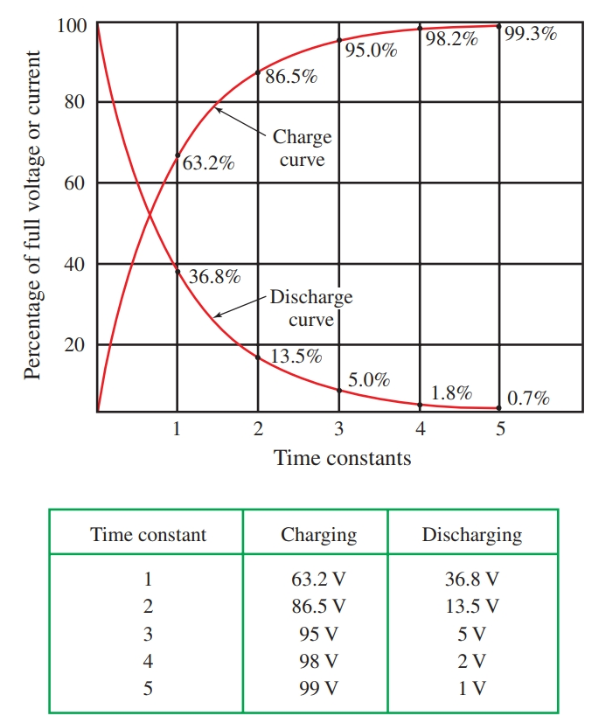
Figure 9. Top–Time constant curves. Bottom–Assuming the E source is 100 volts, these are the voltages at the end of each time constant.
Self-Inductance Key Takeaways
Understanding self-inductance and RL circuit behavior is essential because these principles play a critical role in the design and operation of a wide range of electrical and electronic devices. From the smooth functioning of motors and transformers to the filtering capabilities in audio equipment and radio-frequency applications, inductors help manage current flow effectively and protect circuits from sudden changes in voltage. The concept of transient response and time constants is particularly important in timing, signal processing, and energy storage applications.