The article explores Global wind patterns and their causes, including atmospheric circulation cells and the Coriolis force, while examining the development, potential, and environmental impacts of wind energy as a renewable resource. By highlighting the role of Global Wind Patterns in modern electricity generation, it also addresses challenges such as land use, noise, and visual concerns.
Sailing ships have been using the wind for thousands of years. The wind was thought to be first used for pumping water by the ancient Persians. They adopted the idea of using the sail to capture the wind in a vertical-style windmill. The Persians and later the Romans also used the wind to power mills for grinding grain, hence the term windmill. Today, the wind offers a clean renewable energy source that can turn the shaft of a generator to create electricity or be harnessed directly to drive a pump.
Global Wind Patterns
The earth’s prevailing winds are the result of two major factors: differential heating and the earth’s rotation. A three-cell model of global circulation is a starting point for understanding the prevailing winds, but keep in mind that seasonal changes and landmasses have a major effect on these patterns.
Heating warms the moist air near the equator, which rises because of lower density. This moist air cools and dries as it moves away from the equator. As the warm air moves up in the atmosphere, cooler air moves in to replace it.
In the northern hemisphere, this cooler air moves from north to south at low altitudes; in the southern hemisphere, it moves from south to north. This process forms an atmospheric circulation cell that is called the tropical cell (also called the Hadley Cell). The process forms a high-pressure region in the vicinity of 30° latitude, where the air sinks.
In addition to the tropical cells on either side of the equator, each hemisphere has a mid-latitude cell (also called the Farrell cell) and a polar cell. The predominate air movement from these cells is shown in Figure 1. As the air in the mid-latitude cells moves toward their respective poles, colder air from the polar region is encountered, so the warmer air moves up and over the air from the poles, creating a lower-pressure region.
In the Polar Regions, the cold dense air tends to circulate away from the poles at lower elevations and forms the polar cells. Warmer air rises above the cold polar air and tends to move from a region of high pressure to low pressure; this pressure gradient difference creates a force that moves air in the cells.
When the earth’s rotation is taken into account, the winds are deflected by the Coriolis force, which adds an east-west component to the movement of the air in the cells.
The Coriolis force is a fictitious force that explains how the rotation of the earth creates an accelerating reference frame for an observer on earth; as a result, the observer concludes that the resulting motion is due to a force.
To understand the Coriolis force, imagine sitting on one side of a spinning platform and throwing a ball across the center of the platform to someone sitting on the opposite side. You and the person on the other side are said to be on an accelerating reference frame. When the ball leaves your hand, it does not experience any force other than gravity (ignoring air friction). The person on the other side would say the ball had curved away because that person was rotating as well. He or she could explain the ball’s curving away by assuming he or she was stationary and the ball had experienced a force, that is, the Coriolis force.
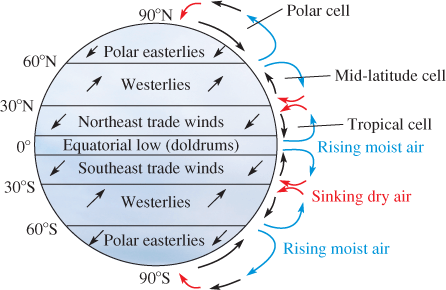
Figure 1: Global Wind Patterns
In the regions north and south of the equator, the trade winds blow primarily from the east to the west due to the Coriolis force combined with the pressure gradient difference in the circulating tropical cell.
The trade winds were so named because they enabled trade between Europe and the New World in sailing days. When wind direction is specified, it is always named as the direction from which it blows.
The trade winds are easterlies and are primarily responsible for the movement of hurricanes that are spawned in the equatorial regions. At the equator, there is no Coriolis force, so the winds diverge toward the equator and create a low-pressure region with the very calm wind, which was given the name doldrums. Early sailors obviously wanted to avoid the doldrums.
In the mid-latitude cells, the circulation is opposite that of the tropical cells, and with the addition of the Coriolis force, the surface winds blow primarily from west to east. Thus, the mid-latitude winds are referred to as westerlies.
On the west coast of the United States, the westerlies tend to move the weather from the Pacific to the coast, and they produce wind that tends to channel into mountain passes. The westerlies are also responsible for bringing wet weather from the Atlantic across western Europe.
The mid-latitude winds tend to vary more because of many factors, including high- and low-pressure regions that tend to form and last several days. The types of air masses that form in these regions vary depending on whether they are formed over a continent or out at sea and whether they have a tropical or polar origin. The boundaries between air masses are called fronts, and these fronts mark the most active regions of weather.
In the polar regions, the polar easterlies are cold, dry winds that flow from high-pressure regions at the poles toward low-pressure areas in the mid-latitude regions. These winds tend to be weaker irregular winds.
Superimposed on the global patterns are effects due to landmasses and large bodies of water. Air temperature varies because the earth’s surface heats up at different rates.
Landmasses tend to heat and cool more quickly than water does, and mountains tend to be cooler than valleys. Latitude, season, cloud cover, and other factors also cause temperature and pressure variations and create variable conditions for wind and weather. Wind always tends to flow from a high-pressure area toward a low-pressure area, and these changes depend on many factors, as you have seen.
In addition to surface winds, the advent of high-flying aircraft led to the discovery of a high, fast-moving river of air moving from west to east known as the jet stream, which is created by temperature gradients in the atmosphere. The jet stream has a significant impact on weather and the location of high- and low-pressure regions in the atmosphere.
Each hemisphere has a jet stream that marks the boundary between cold polar air and warmer mid-latitude air. It constantly changes its pattern both daily and seasonally, so it is monitored constantly by weather forecasters. In the winter, the jet stream tends to move closer to the equator; in the summer, it moves away from the equator. Because the speed of the winds is extremely high, there is some interest in developing the ability to harvest its energy, but plans for this are still in the concept stage and it will be years before any actual device is ready for the jet stream.
Currently, prototype models of tethered wind turbines have been flown by several innovators to show the feasibility of flying turbines in the high-altitude winds but these are far below the jet stream. At 500 m above the ground, wind speeds tend to double and have roughly 8 times the energy of ground-level winds. Even more energy is available higher up, so the potential for significant energy harvesting is enticing.
As in the case of the solar resource, maps are available for wind resources based on historical patterns. The United States has a large wind resource that, if fully exploited, could easily meet all of the electricity demand. So far, however, the wind has not proven suitable for baseline power.
According to a report from the National Renewable Energy Laboratory (NREL), there are potentially 4,150 gigawatts (GW) of potential wind power available within the United States and within 50 nautical miles of the coast. This is based on a wind speed of at least 7 mi/s (16 mph) and within a height of 90 m (295 feet). The major areas for wind resources tend to be on both coasts, the Great Lakes, and in the Midwest to the east of the Rockies. Figure 2 shows the US wind resource based on the NREL data along with major transmission lines.
Figure 2: Wind Resource and Transmission Lines for the United States
Maps such as the one in Figure 2 are useful to gain an overview of the resource, but the map lacks the details necessary for specific site selection and evaluation. For these kinds of assessments, maps with much finer detail are available for almost any location in the world that can pinpoint wind (or solar) conditions for a given site based on observational data and computer modeling.
For the wind resource, hourly average wind speeds for each month and at various tower heights are only one of the many options to consider for locating a wind farm. Table 1 shows an example of hourly wind data for each month at a given site that enables managers to determine optimum operation.
World data for wind between 60°S and 70°N is shown in the map in Figure 3. Some of the data is based on various models of the atmosphere and small-scale terrain features. Data over the ocean (not shown on the maps) is available based on satellite observations of waves using an instrument called a scatter meter, which uses radar scattering to measure wave height and surface winds.
The detailed data, including hourly wind speed, wind direction, air temperature, and air pressure for three different heights above the ground, for any given site, can be downloaded from 3TIER to evaluate any particular site for wind energy.
The key areas where wind energy is being developed include the Midwest and some inner coastal areas of the United States and offshore in Europe.
In terms of offshore wind, the United Kingdom and Denmark are far ahead of other countries. As already mentioned in regard to solar power, wind power cannot generally serve as baseline power without significant (and expensive) storage capability; however, some offshore locations may be able to offer very reliable power. (Samso Island, a small island in the North Sea off the coast of Denmark, is trying to go 100% wind power for its 4,000 residents).

Table 1: Wind Speed as a Function of the Time of Day and Month
Over 240 GW of installed power from wind turbines worldwide can provide over 500 terawatt-hours of energy on an annual basis. This is roughly 3% of the electricity consumption worldwide. The World Wind Energy Association estimates that installed capacity will be over 1 terawatt by 2020. Currently, the five largest markets are China, the United States, Germany, Spain, and India, with China accounting for 44% of the world wind market.
Environmental Impact of Wind Energy
Wind energy has many attributes that make it environmentally friendly, including no emission of carbon dioxide like fossil fuels, produce, but it does have some drawbacks. The land required for wind turbines is substantial, and some people criticize the appearance of wind farms as a visual eyesore. Wind turbines are typically the tallest structures in an area, so they are visible for miles. These structures may also create a hazard for small aircraft. Newer wind turbines tend to be even taller, compounding the problem. In addition to the height and area requirements for wind turbines, they can have negative impacts on historical, recreational, and cultural sites.
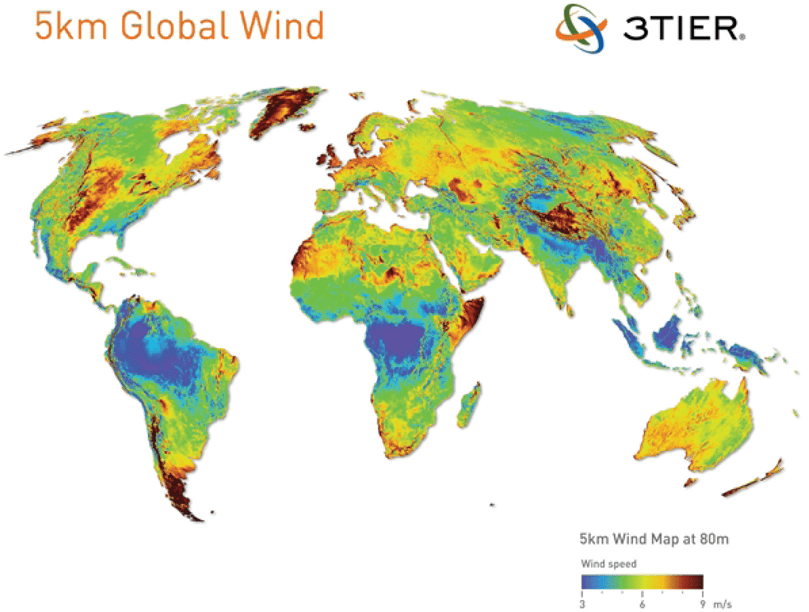
Figure 3: Global Wind Speed Map
Another issue is noise. Wind turbines produce noise that can be annoying to nearby residents (generally those within 2 miles). The source of noise is twofold: (1) mechanical parts that vibrate and (2) aerodynamic noise from the blades. Wind machine manufacturers have made excellent progress in reducing mechanical noise by damping vibrations, adding insulation and special gearboxes, and engineering every part of the wind machines for low-noise operation.
The aerodynamic swishing sound of the turbines can cause sleep disturbance in some cases, and some people complain of other health-related issues. Aerodynamic noise is highly dependent on rotor speed; newer turbines rotate more slowly and create much less noise than early models. Helical turbines (such as the Quietrevolution models in England) are designed for quiet running and work well in environments where people are nearby.
Another environmental effect is that of bird strikes by the wind machines. The numbers of birds killed by wind machines are in dispute because the numbers from different sources vary widely. Data from the American Wind Energy Association indicates that wind power causes far fewer losses of birds (approximately 108,000 a year) than other human-caused deaths: buildings (100 million to 1 billion), power lines (130 million), cars (60 to 80 million), pesticides (67 million), domestic cats (at least 10 million), and radio and cell towers (4.5 million).
Although the number of bird kills is low compared to other sources, expansion of transmission lines could increase the number. The number of total kills from wind machines masks the fact that certain species appear to be more vulnerable than others. In one study, the wind farm at Altamont Pass in California is responsible for the death of 80 golden eagles per year (a protected species) and thousands of other birds.
But the goal is to reduce the number of bird strikes, and this effect has been reduced significantly in recent years because of slower-moving turbine blades that birds can see and avoid. In addition to slower blades, wind turbine manufacturers have tested different paints and reflective devices on the blades. The sound of the turbine itself can help birds avoid the blades.
There is also concern about locating wind machines in pathways used by migratory birds because this could alter the routes used by the birds. One way to help cut down bird strikes is to use monopole towers rather than the lattice towers used on older machines, which helps to cut down nesting sites on and around the wind turbine itself.
Many of the best locations for wind farms are miles away from the end users of the electricity. As a result, transmission lines need to be constructed; these have their own environmental impact, including land requirements, complaints about them acting as visual eyesores, and bird electrocution. One option to alleviate this condition is underground transmission lines, but this is expensive.
Another impact is the appearance of wind turbines. The visual impact of wind turbines is hard to alleviate; however, larger and more efficient models may help. Locating wind farms farther from population centers and highways, and limiting the number and height of wind turbines in residential or commercial areas are other ways to alleviate eyesores.
For offshore wind turbines, locating the wind farm further from shore also has a less visual impact but much higher capital costs for both the towers and the transmission lines to bring power to shore.
New installations have run into public acceptance issues, particularly with visual impact and the effect on recreational boating. On the positive side, offshore wind turbines can be located closer to population centers, and they alleviate the need for long transmission lines and the power losses associated with them.
Global Wind Patterns Key Takeaways
Understanding Global Wind Patterns is essential for grasping how atmospheric circulation and the Coriolis force influence weather systems, climate zones, and the movement of storms. These patterns not only shape our environment but also play a critical role in applications such as aviation, maritime navigation, and, most importantly, renewable energy generation. With the advancement of wind technology, identifying and leveraging Global Wind Patterns allows for more efficient placement of wind farms, maximizing electricity production while minimizing environmental disruption. As the world shifts toward sustainable energy solutions, a deep comprehension of Global Wind Patterns ensures that we harness wind power responsibly and effectively, securing a cleaner future.