The solar energy directed at earth is considerable. The sun has far more energy associated with it than we need, but its energy is spread out over the surface of the earth. The solar constant of 1,368 W/m2 is the amount of energy received on a surface that is outside the atmosphere and oriented perpendicular to the sun’s rays at the mean distance of the earth from the sun.
When averaged over the earth’s entire surface for a 24-hour period (day and night), the solar constant is one-fourth of the solar constant or 342 W/m2 at the outer edge of the atmosphere and much less at the earth’s surface. Several factors affect this number, including clouds that reflect sunlight back into space, the scattering of sunlight in the earth’s atmosphere, and absorption of energy in the earth’s atmosphere.
The Solar Spectrum
The earth receives energy from the sun in the form of radiation. A portion of this energy is in the visible range, which is in the wavelengths from 400 nm (blue) to 700 nm (red). Much of the energy we receive is in the infrared region (wavelengths longer than 700 nm) and some is in the ultraviolet region (wavelengths shorter than 400 nm).
The spectral distribution of energy from the sun at the top of the atmosphere approximates a black body at a temperature of 5,770 K. (K stands for kelvin, which is the absolute temperature scale. K = °C + 273.15.) In physics, a black body is one that absorbs all radiation falling on it and then re emits it in a wavelength that is related to its absolute temperature. The actual temperature of the sun’s photo-sphere varies from about 4,400 K at the lowest level to 7,500 K at the highest level.
The basic shape of the spectrum is described by an equation called Planck’s energy distribution, which gives a good approximation of the measured spectrum. Figure 1 shows the measured spectrum at the top of the atmosphere and at sea level. The sea level plot varies depending on location and amount of water, clouds, and other materials in the atmosphere; a significant fraction of the incident radiation is scattered and absorbed by the atmosphere.
At shorter wavelengths (ultraviolet), the incident radiation is significantly attenuated by ozone (O3) in the stratosphere, which absorbs the ultraviolet portion of the solar spectrum. This absorption is critical to life on earth, so maintaining this shield is crucial.
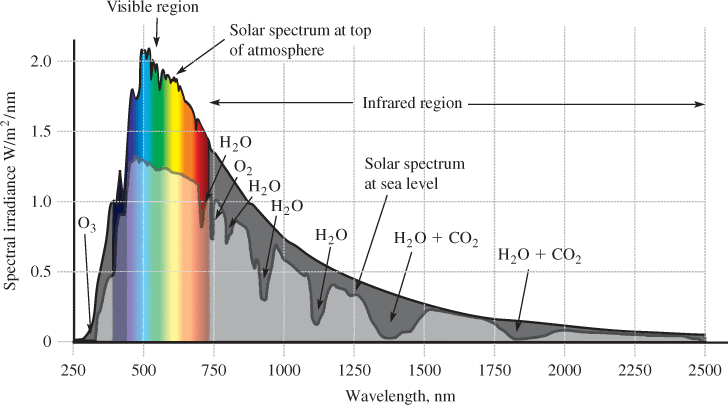
Figure 1: Solar Spectrum at the Top of the Atmosphere and at Sea Level
In the ultraviolet (UV) region (wavelengths less than 400 nm), ozone is responsible for much of the absorption, a fact that helps protect us against harmful UV rays. Water vapor and carbon dioxide are the primary gases that contribute to global warming by absorbing shorter wavelength radiation from the sun and reemitting it at longer infrared wavelengths. Thus, the earth is warmed by these gases and they contribute to the average temperature on earth. This is why an increase in atmospheric carbon dioxide, which has risen steadily for the past 200 years, has many scientists concerned about its effect on climate.
The sun emits energy in all directions, so the incident radiation at the top of the atmosphere follows a familiar law in physics known as the inverse square law, which states that the flux from an isotropic point source is reduced by the square of the distance from the source to the receiver (the sun is at such a great distance, the inverse square law is quite accurate).
Recall that the solar constant is defined as the amount of energy received on a surface that is outside the atmosphere and oriented perpendicular to the sun’s rays at the mean distance of the earth from the sun. From the power output of the sun (approximately 3.847 × 1026 W) and the inverse square law, it is simple to calculate the intensity of sunlight at the top of the atmosphere (solar constant, S):
S=Psun/4πr2=3.847×1026W/4π (149.6×10⁹m) 2=1,368W/m2
Where
S = the solar constant (W/m2)
Psun = the power emitted by the sun (W)
r = the radius of a sphere equal to the sun–earth mean distance (149.6 × 10⁹ m).
The calculation is illustrated in Figure 2. Notice that the unit for the solar constant or insolation, is power (W) divided by area (m2). Insolation (from incident solar radiation) can also be measured in units of kWH/m2/day, which is easier to relate to electrical units (1 W/m2 = 0.024 kWh/m2/day). The value of S is 32.8 kWh/m2/day at the outer edge of the atmosphere.
Because of the earth’s rotation, the intensity of sunlight received on its surface is averaged over a twenty-four-hour period. Clouds and the atmosphere, which vary significantly by location, have a major effect on the amount received on the surface.
As the solar energy passes through the atmosphere, photons are scattered and absorbed by molecules and atoms in the atmosphere. By the time it reaches the surface of the earth, the spectrum has changed because of this scattering and absorption. Most of the absorption can be accounted for by water vapor, oxygen, and carbon dioxide, with carbon dioxide absorbing the most. Because of absorption and reflection, and depending on the location, time of year, cloud cover, and so forth, the amount of solar insolation that reaches the earth’s surface is reduced.
The peak solar intensity at the earth’s surface is between 800 and 1,000 W/m2, but for practical reasons, a time-average over the course of the year is often cited on maps. This time-averaged value takes into account all variables, including night time, average cloud cover, smog, and so on, for a given location. The radiation reaching the earth’s surface is given in three different ways.
Global horizontal irradiance (GHI) is the total amount of shortwave radiation received on a horizontal surface. This value is of particular interest for photovoltaic installations.
The portion of GHI that comes in a straight line from the sun is called direct normal irradiance (DNI).
Some of the scattered radiation arrives at the earth’s surface from indirect paths and is called diffuse horizontal irradiance (DHI). The GHI value includes both the direct and diffuse irradiance. Both direct irradiance and diffuse irradiance are useful for solar applications like flat-plate collectors, but only direct radiation can be focused using concentrating collectors.
Maps are available that show the direct radiation suitable for determining the solar input for concentrators, or the GHI that is useful for determining the solar input for flat panels.
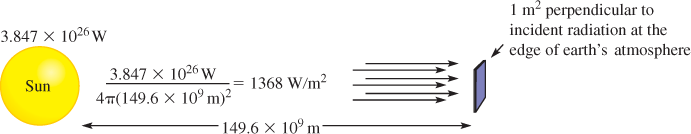
Figure 2: Calculation of the Solar Constant, S
EXAMPLE 1
Assume a flat solar collector is 150 cm wide by 180 cm high and is oriented so that it is perpendicular to the sun. Its active area is 90% of the panel size. What is the peak power delivered to the active area of the collector if it is in a location that receives solar insolation of 1,000 W/m2peak?
Solution
Active area=90%×1.5m×1.8m=2.43m2
Power=1,000W/m2×2.43m2=2.43kW
The solar resource depends on weather and location on earth as well as other factors. Figure 3 shows the solar resource, averaged over a full year, for the United States. The area shown in red is the best area for locating concentrator collectors because it has the most direct radiation.
While the map gives a good general indication of locations that can benefit from solar energy, more detailed information is needed for planning a specific project. For the United States, the National Solar Radiation Database (NSRDB) is a document available from the National Renewable Energy Laboratory (NREL) that describes the amount of solar energy available at any location. It includes data for each component of solar radiation.
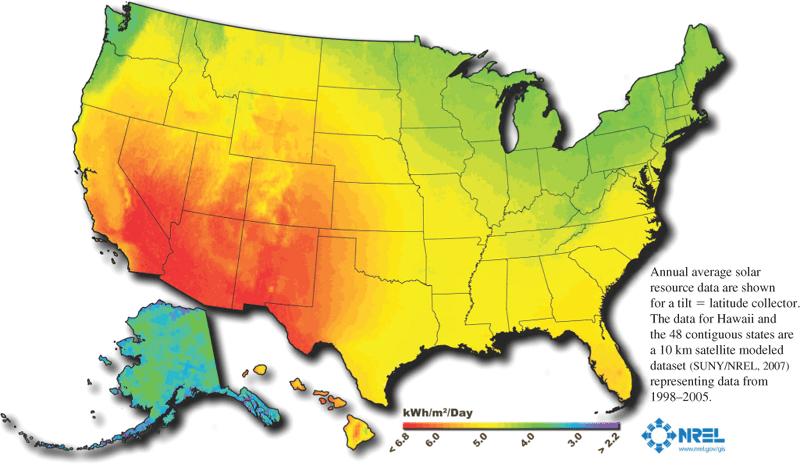
Figure 3: Average Annual Solar Resource for the United States

Figure 4: Average Annual Global Solar Irradiance
World data for annual average solar irradiance is shown in the map in Figure 4. As in the case of the NREL data, the data in this map is derived from satellites but has higher resolution (approximately 3 km) and covers a time period of at least eleven years. The detailed data for any given site can be downloaded from 3TIER to determine a range of expected irradiance values and to provide an assessment of any particular site in the world.
Variations in the Solar Constant
Much progress has been made in understanding the sun and its magnetic field, which is responsible for sunspots. Sunspots are places on the surface of the sun where the magnetic fields break through the surface. Sunspot frequency has a normal eleven-year cycle, going from minimum activity to maximum. A period occurred between 1645 and 1715 in which sunspot activity almost ceased. This period, known as the Maunder minimum, corresponded to a much cooler global climate, including much colder winters. A NASA computer climate model suggests that there was a reduction in the solar constant during the Maunder minimum.
Questions still linger about the variability of the solar output and why the Maunder minimum occurred. From satellite measurements since 1978, we know that the solar constant varies, and it is about 0.15% higher during sunspot maximum than during sunspot minimum. Although the sunspots are cooler areas that radiate less energy, the area surrounding them is hotter, which accounts for the higher output. But these questions remain: How constant is the sun’s output over the long term? Can an event similar to the Maunder minimum occur again and contribute to global cooling?
Global Climate
Climate is the long-term average weather effect at some location. Factors affecting climate include the effects of oceans, mountains, rivers, and atmospheric conditions such as cloud cover and wind. Very little effect on climate can be attributed to solar variations over the more than 50-year timeframe that satellites have observed the sun. Global warming is well documented, but factors influencing global warming include greenhouse gases in the atmosphere rather than variations in the solar output.
Environmental Effects of Solar Energy
All sources of energy, including renewable energy, have some environmental effects. The process of converting sunlight to usable energy generates no pollution, but the chemicals used to create certain solar materials (panels, inverters, etc.) include hazardous materials.
Chemical spills can cause pollution; in September 2011, fluoride from solar cell waste storage contaminated a river. Other dangerous chemicals are used in the production of solar cells and can create an environmental hazard if they leech into a landfill. A consideration in the full life cycle of solar production is the disposal of waste in the production process and waste disposal when the product is at the end of its usable life.
Water use is another environmental issue that needs to be addressed prior to construction of solar installations. Steam generators are used in utility power generation, and they can be a problem for water tables in arid regions, which tend to be best for solar insolation. Solar systems vary widely in the amount of water required; photovoltaic (PV) systems require water only for cleaning, whereas most power tower systems require water for driving turbines. Some systems require additional cooling water.
Another environmental effect is land use. Most small solar PV systems are located on roofs and over parking areas, so they have little or no impact on land usage. Some large arrays use solar collectors for utility power generation and thus require many acres of land. This amount of land use can have a large impact on certain species of wildlife.
Typically, five acres of land are required for each megawatt of capacity from the solar collectors. Concentrating PV systems and power towers are the most efficient solar systems when considering the use of land. A commercial solar power plant has a much larger footprint than a comparable coal-fired plant, but if the entire area required for mining coal and storing waste is factored in, the solar footprint is actually less.
Another land-use issue involves locating solar arrays on valuable agricultural areas. This is important in areas like California’s inland valleys, where prime growing areas exist. For example, Fresno, Imperial, and Kern counties in California have some of the most productive agricultural land in the United States, partially because of the abundance of sunshine. Planners are proposing restrictions on solar projects that affect food production in these areas.
One way to have agriculture and solar electricity co-exist is being tested in Japan, where special open structures for solar collectors have been constructed that allow enough sunlight to reach the ground for plants to grow underneath.
Another important issue for both solar and wind power is the fact that the resource is not available at all times. Grid operators cannot be assured that solar and wind power is available when they need it, which means backup generation capability must be available.
Solar power is reasonably predictable, but it is affected by clouds or storms in the daytime and cannot serve as baseline (always ready) power that utilities need unless significant storage capability is part of the project.
All about Solar Energy Key Takeaways
Understanding the distribution, intensity, and spectrum of solar radiation is essential for effectively harnessing solar energy for practical applications. These concepts are vital in the design and deployment of solar technologies such as photovoltaic panels and solar thermal systems. Accurate knowledge of solar irradiance—whether direct, diffuse, or global—allows engineers and planners to determine optimal locations, orientations, and system types for maximum energy capture. Additionally, awareness of atmospheric influences, like absorption by ozone and greenhouse gases, helps in climate modeling and assessing environmental impacts. By applying these scientific principles, we can better utilize solar energy as a clean, renewable resource while minimizing ecological disruption and maximizing energy efficiency across various sectors, from residential installations to large-scale utility projects.